Watts Up in your Cluster?
Posted on July 10, 2025 (Last modified on July 11, 2025) • 6 min read • 1,155 wordsMeasuring Power Consumption per Process by Scaphandre

In recent years, environmental concerns—particularly those related to energy consumption—have become a major focus across most sectors. This includes the field of IT infrastructure, where growing awareness of the carbon footprint associated with computation is prompting a shift in how infrastructure usage is accounted. More organizations are now starting to include environmental impact as a metric alongside performance and cost when evaluating their systems.
As part of this shift, there is a need for more fine-grained monitoring of energy consumption. Traditional approaches—measuring power usage at the level of Power Distribution Units (PDUs) or individual power supplies—are no longer sufficient. To support more accurate and responsible reporting, power consumption must increasingly be measured at the level of individual processes running on each node.
Scaphandre and Technical Background
Scaphandre is an open-source tool designed to measure power consumption at the process level and export power metrics through various methods. It supports both Linux and Windows systems and is available as a standalone binary or a Docker image. For Kubernetes environments, a Helm chart is also provided to simplify deployment.
Before diving deeper, let’s explore the technology that powers Scaphandre.
RAPL Sensors
Measuring energy consumption at the process level requires hardware support. Most modern x86 CPUs from Intel and AMD include integrated RAPL (Running Average Power Limit) sensors, which provide estimated energy usage data across several domains—such as the entire CPU package, CPU cores, integrated GPU (iGPU), and DRAM. The availability of specific RAPL domains depends on the CPU generation and vendor.
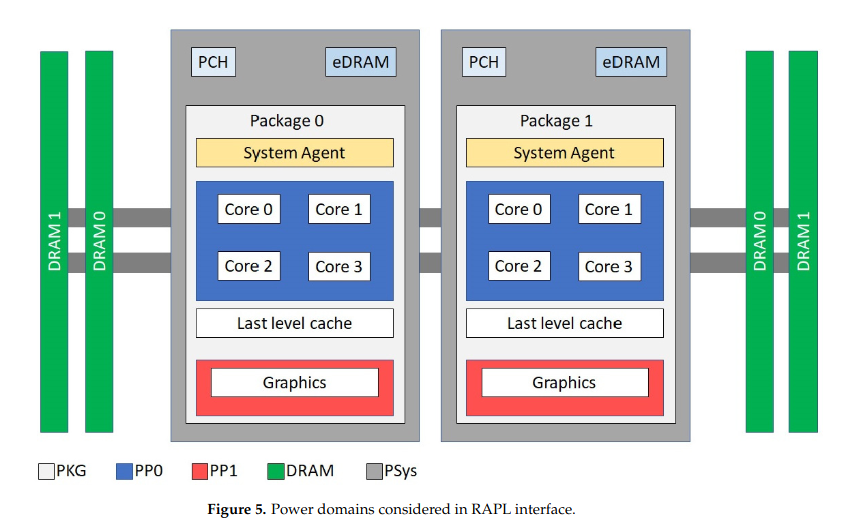
RAPL domains. Source:
Scaphandre documentation
On Linux, RAPL sensors are exposed through the powercap subsystem, accessible via /sys/class/powercap/. For example, to read the energy consumed by the first CPU socket:
sudo cat /sys/class/powercap/intel-rapl:0/energy_uj
9758110032
These counters report energy usage in microjoules per CPU socket. While the values are estimations rather than precise measurements, they are generally accurate enough for comparative analysis and usage-based reporting.
Although RAPL provides critical insights, attributing energy consumption to individual processes becomes increasingly complex on modern systems with multiple CPU sockets and hundreds of concurrent tasks.
Jiffy
In Linux, a jiffy is the kernel’s fundamental unit of time, defined as the interval between two timer interrupts. Its duration is determined by the system’s configuration—typically 1ms (1000 Hz), 4ms (250 Hz), or 10ms (100 Hz)—as set by the CONFIG_HZ kernel parameter.
The Linux kernel uses jiffies for various timekeeping and scheduling tasks, including tracking system uptime, CPU usage, and individual process runtime. Several jiffy counters are maintained by the kernel, and relevant data can be found in /proc/stat (for system-wide statistics) and /proc/[pid]/stat (for per-process data).

A simple visualization of time intervals (jiffies) tracked by the system for individual processes and the entire machine. Source:
Scaphandre documentation
From Jiffies to Joules
By periodically sampling both CPU time (measured in jiffies) and energy consumption data from the powercap subsystem, it becomes possible to estimate energy usage per process. The total energy consumed by a CPU socket during a sampling interval can be proportionally distributed among the processes based on their share of CPU time.
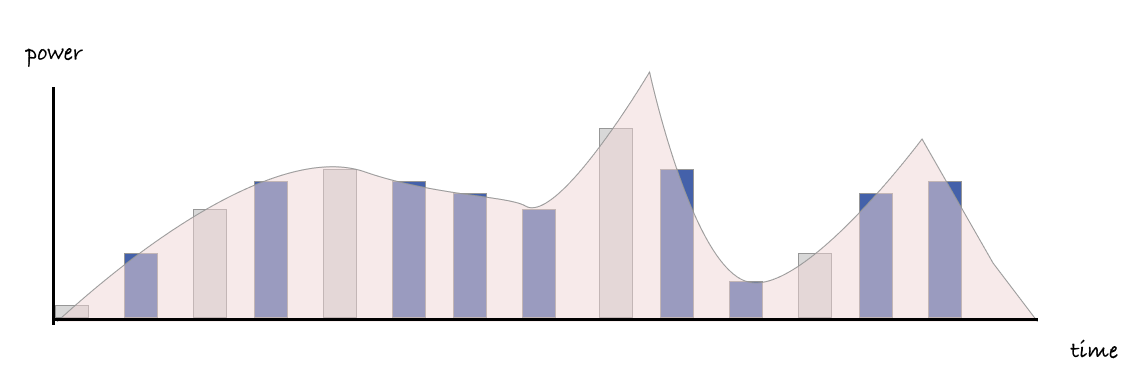
This figure illustrates how individual processes, through their interleaved jiffy intervals, contribute to total power consumption. Source:
Scaphandre documentation
This is the core mechanism that powers Scaphandre’s per-process energy attribution: combining time (jiffies) and energy (joules) to estimate process-level power consumption with minimal overhead.
Using Scaphandre
Processes in Containers
In the containerized world, it’s essential to attribute energy consumption not just to individual processes, but also to the containers and Kubernetes pods they belong to. Scaphandre supports this out of the box.
In such environments, processes are managed within cgroups (control groups), which provide resource isolation and accounting. Scaphandre can interface with the Docker socket or Kubernetes API to map processes to their corresponding containers, pods, namespaces, and more—enabling accurate energy attribution in containerized workloads.
Exporters
Scaphandre offers several exporters—mechanisms to expose collected power metrics. Available exporters include:
stdout– for simple console outputjson– structured output for programmatic useprometheus– for integration with Prometheus-based monitoringqemu– for usage in virtualized environments- and others
In our setup, we used the prometheus exporter to make power metrics available for scraping and visualization.
Visualization
To visualize the metrics, we use Grafana along with PromQL to query Prometheus.
Since we provide large Kubernetes clusters and computing resources to the academic community, visualizing individual processes or pods often offers limited insight. This is because pods that belong to the same computational workflow may be distributed across multiple nodes and typically act as short-lived tasks rather than persistent services.
In this context, the most meaningful level of aggregation is the Kubernetes Namespace, which logically groups related workloads under a common organizational unit.
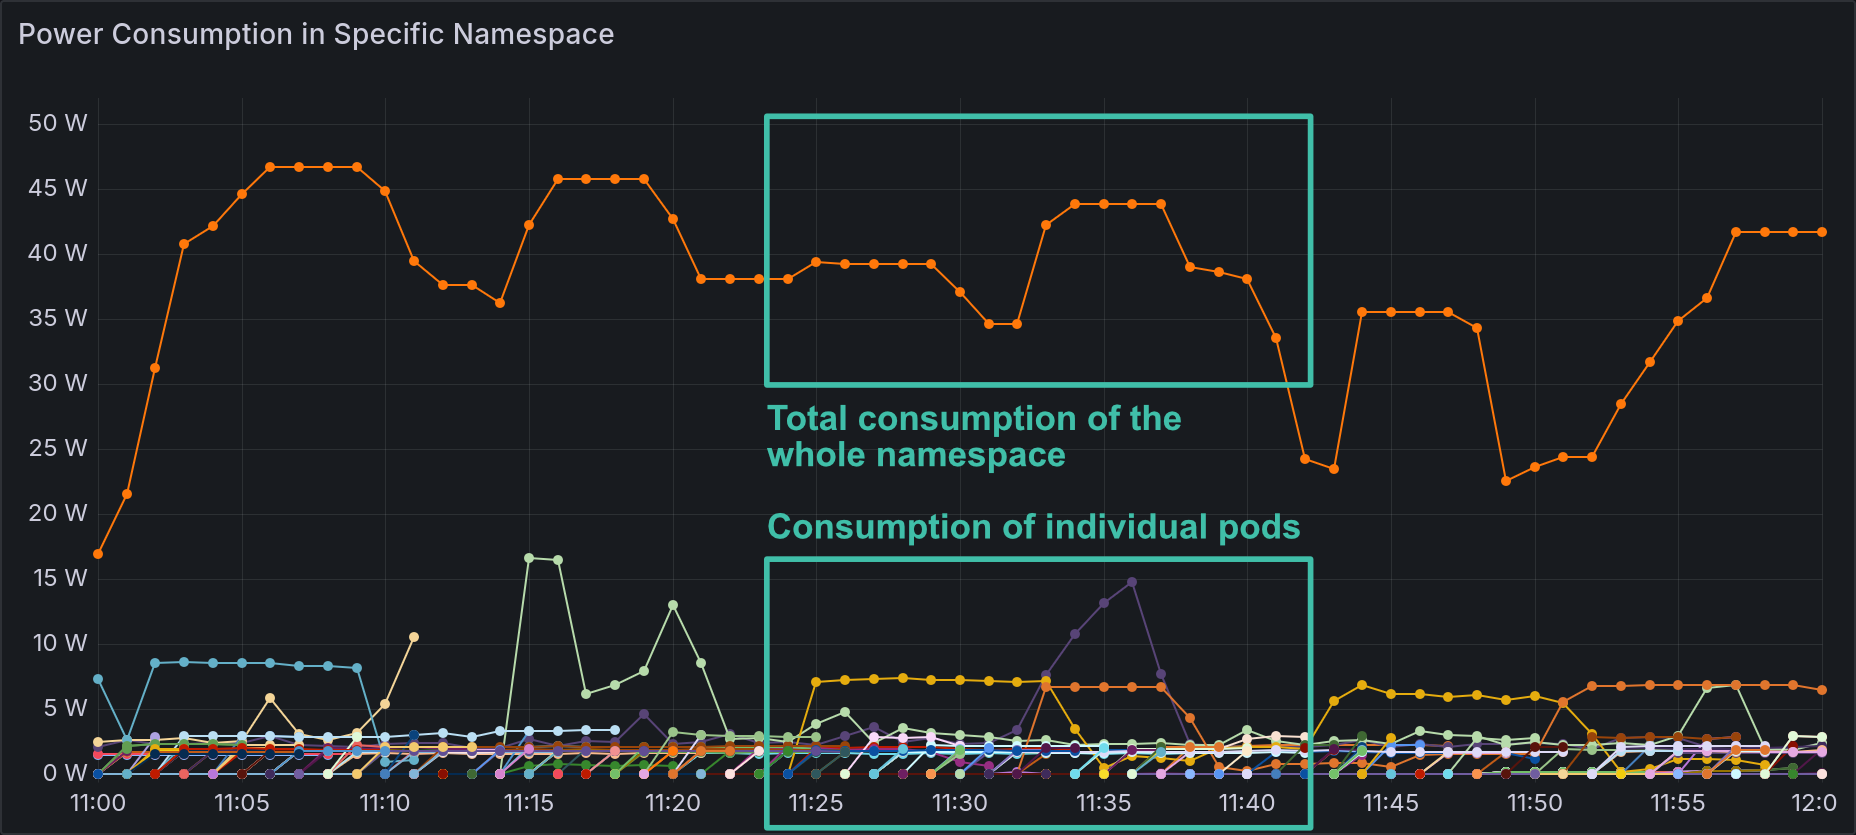
This chart combines two queries to show the difference between power consumption by individual pods within a specific namespace and the total power consumption of the entire namespace.
In our case, the total consumption at the namespace level is the most useful metric. Here are the queries used:
A simple PromQL query to show the power consumption of all pods in a specific namespace (values in microwatts):
scaph_process_power_consumption_microwatts{kubernetes_pod_namespace="loslab-comp"} / 1e6An aggregated query to estimate total power consumption of the namespace, using a 90th percentile over a 5-minute window (values in microwatts):
quantile_over_time(0.9,
    (sum by(kubernetes_pod_namespace) (
        scaph_process_power_consumption_microwatts{kubernetes_pod_namespace="loslab-comp"})
    )[5m:1m]
) / 1e6
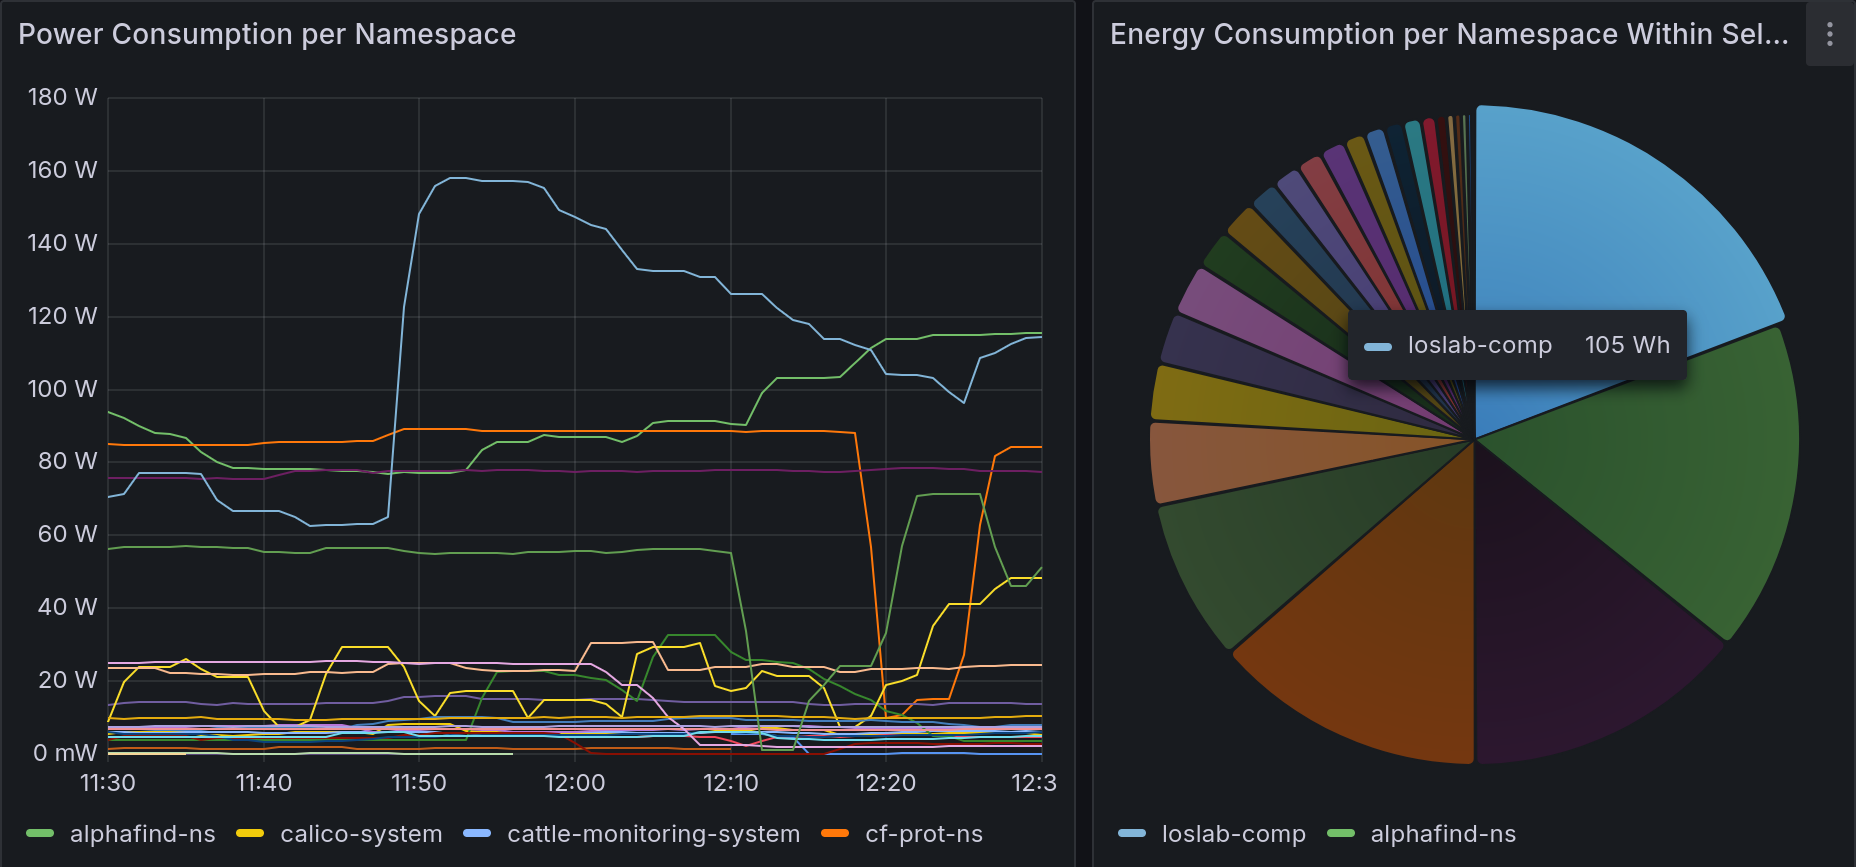
Final dashboard showing two charts: one displaying power consumption per namespace across the cluster (in watts), and another pie chart showing energy consumption (in watt-hours) by namespace over a selected time range.
The first chart uses a query similar to the one above. The pie chart, however, calculates energy consumption by averaging power usage over the selected time range and converting it to watt-hours:
(
    avg_over_time(
        (sum by (kubernetes_pod_namespace) (
            scaph_process_power_consumption_microwatts{kubernetes_pod_namespace!=""})
        )[$__range:1m]
    ) / 1e6
) * ($__range_s / 3600)
Limitations
RAPL sensors provide power consumption data only for CPU and memory components—they do not cover other hardware such as GPUs, storage drives, or network interfaces. In clusters with power-hungry components like GPUs or numerous disks, CPU-related power usage can represent only a small fraction of the total energy footprint.
Support for GPU measurement in Scaphandre is
planned, but not yet available. In the meantime, GPU power monitoring must be handled separately. For NVIDIA GPUs, tools such as nvidia-smi or the more advanced
NVIDIA DCGM can be used to collect power metrics.
Additional Notes
Beyond basic process-level measurement and container mapping, Scaphandre also supports tracking energy consumption of processes running inside KVM/QEMU-based virtual machines. Since RAPL sensors are not exposed to guest VMs, a Scaphandre agent must be deployed on the hypervisor. In this setup, Scaphandre exports qemu processes to represent resource usage by the virtual machines.
As of July 2025, Scaphandre still has several known limitations, including:
- Lack of support for cgroup v2
- Incomplete handling of overflowing energy counters
To address these issues, we created a fork of the original Scaphandre repository with targeted improvements and fixes for these shortcomings.