From "Vibe Coding" to Production
Posted on January 30, 2026 (Last modified on January 31, 2026) • 12 min read • 2,381 wordsMastering Claude Code in Jupyter Notebooks
How Claude Code Turns Jupyter Notebooks into a Collaborative AI Workspace
Jupyter Notebook is a fantastic tool for data science, research, and exploratory programming. But what if you had an AI assistant right inside your notebook, one that can understand your project context, help debug complex code, and even navigate your file system?
That’s exactly what Claude Code brings to our JupyterHub. Whether you’re a Python novice or a seasoned ML researcher, Claude Code can elevate your productivity by acting as a real coding partner rather than just a glorified autocomplete.
Let’s dive into what makes agentic AI assistants different—and how you can harness their full potential.
Why Claude Code Isn’t Just Another Chatbot
Most AI coding tools, especially LLM-based ones, operate in isolation. They generate code snippets but lack deeper context—they don’t know what’s in your dataset, where your files are located, or what your research goals entail.
Claude Code, however, is agentic: it doesn’t just respond—it acts intelligently within your environment by:
- Reading your entire notebook (so it knows exactly what you’ve already done)
- Analyzing data structures (to suggest meaningful transformations)
- Navigating your file system (finding scripts, datasets, and logs)
- Understanding project goals (from your comments, variable names, and conversations)
- Secure, internal processing (all computations happen on e-INFRA CZ’s infrastructure, not external APIs)
This means your workflow evolves from “Let me copy-paste this solution” to “Let’s build this together—what do you think?”
Security reassurance → Since everything runs on e-INFRA CZ’s internal LLM platform, your sensitive research data stays protected.
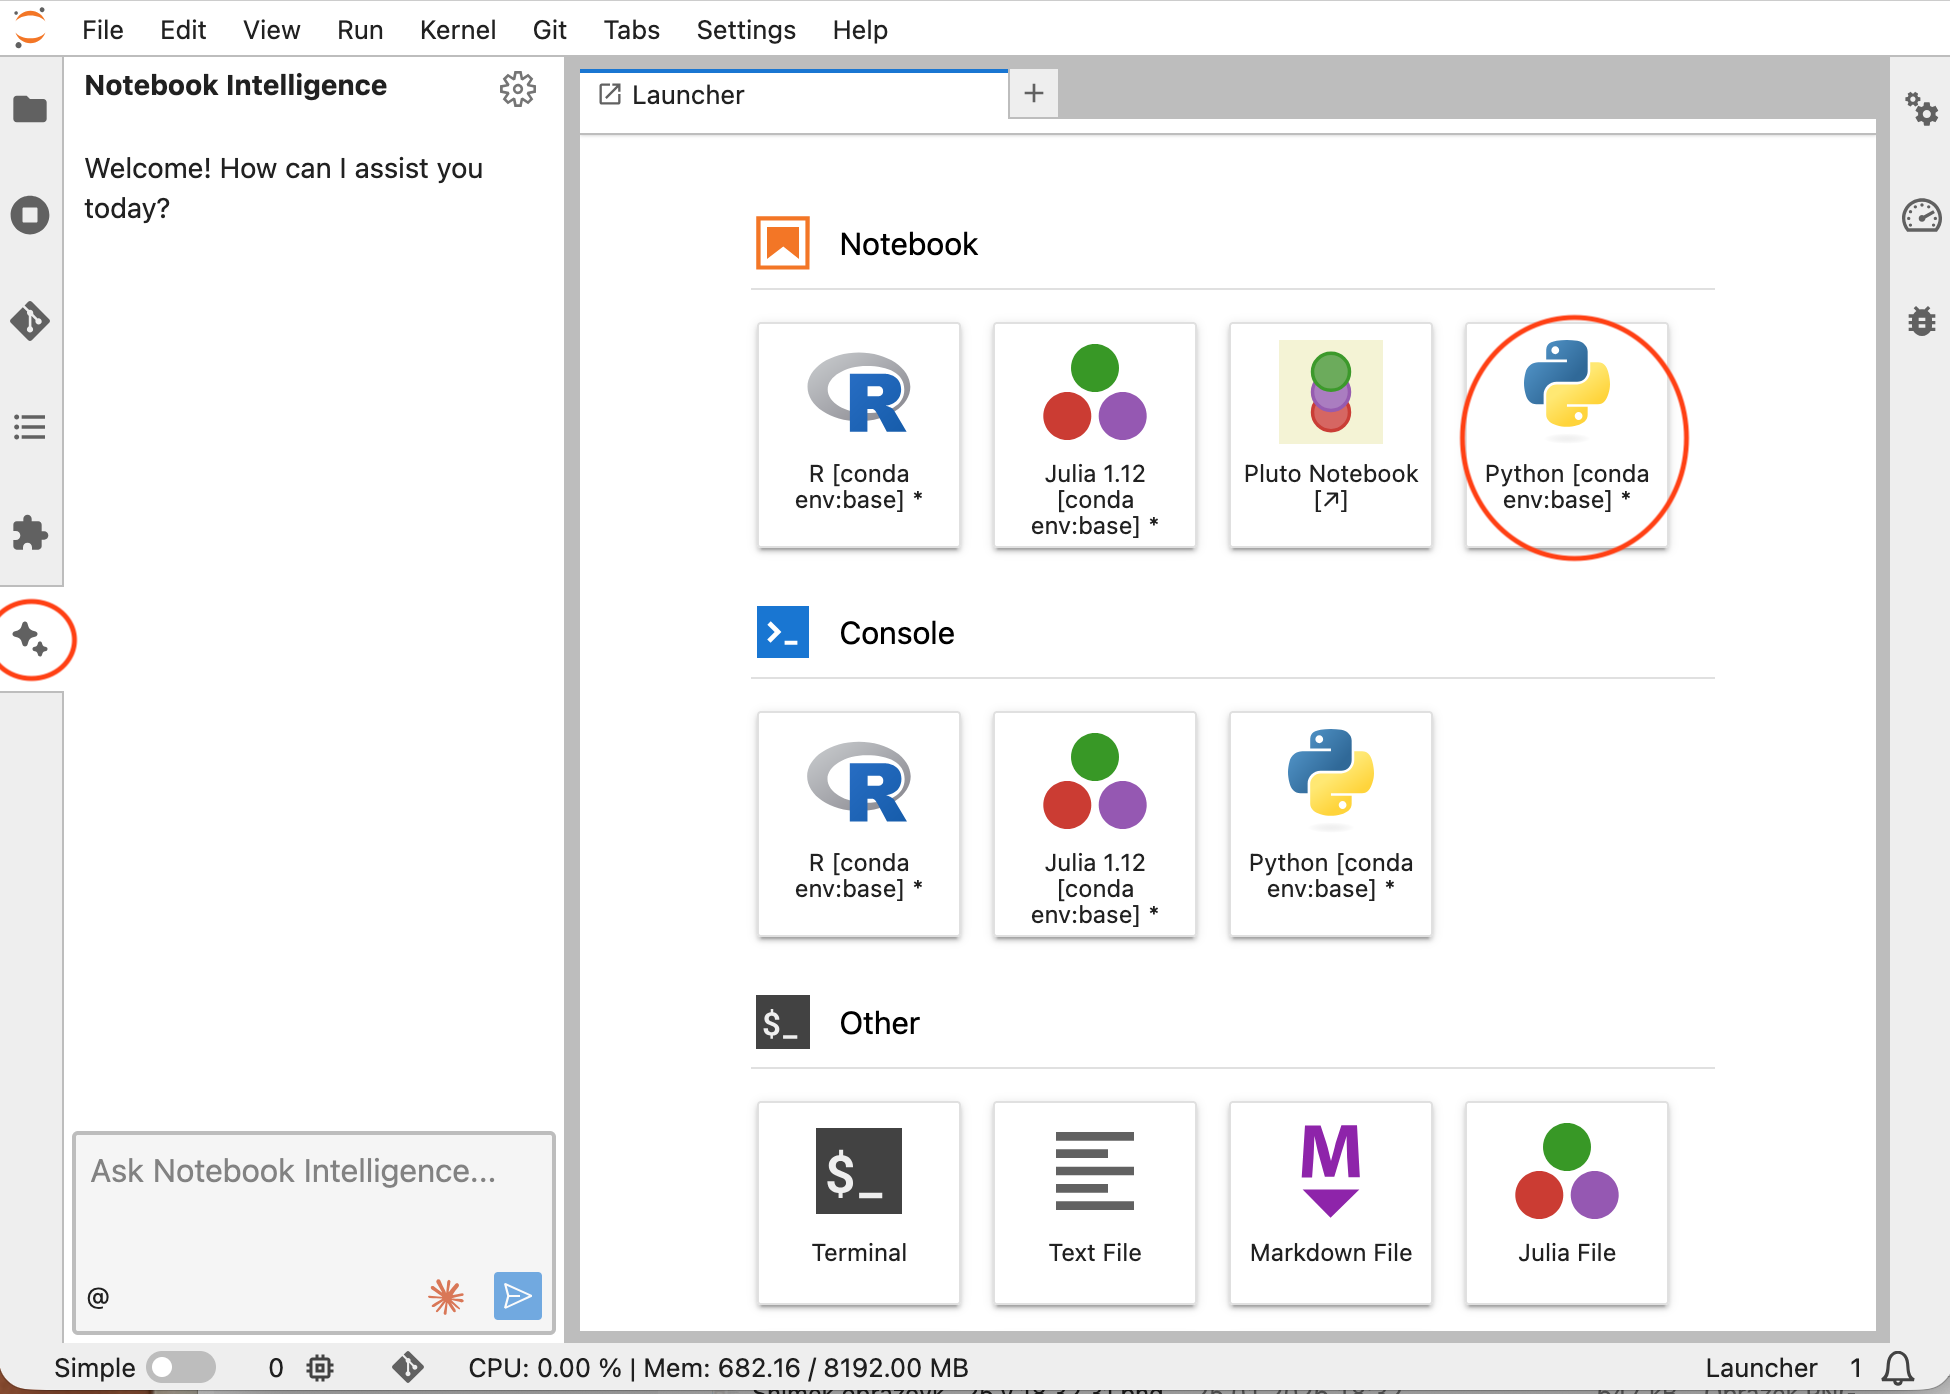
Getting Started: Setting Up Your AI-Powered Notebook
Getting started is simple, but requires the right environment:
- Log in hub.cloud.e-infra.cz with your MetaCentrum credentials.
- Add a new server → Give it a descriptive name (e.g., ai-research-lab).
- Select the Claude Code special image
cerit.io/hubs/datasciencenb:2026-01-23-ai; this ensures the AI assistant is properly integrated.

- Request resources → For data-heavy tasks, start with 2-4 CPUs and 8-16GB RAM. If you need GPU acceleration, Claude can help manage that too!
- Start an empty notebook.
When your notebook launches, you’ll see the Claude Code interface—usually as a sidebar or chat panel—ready for conversation.
.
Key commands you’ll use frequently within Claude:
# Get help and see all available commands
/help

# Clear conversation history
/clear

# Exit Claude
/exit

#Tab completion works for commands
#Type / and press Tab to see available commands
Mastering Claude Code: Four Levels of AI-Assisted Programming
Level 1 Beginner – “Vibe Coding” with Claude
You describe the task, Claude writes the code.
Even if you’re new to Python, you can get useful results by simply explaining your goals. This is “vibe coding”—where you focus on the what, and Claude handles the how.
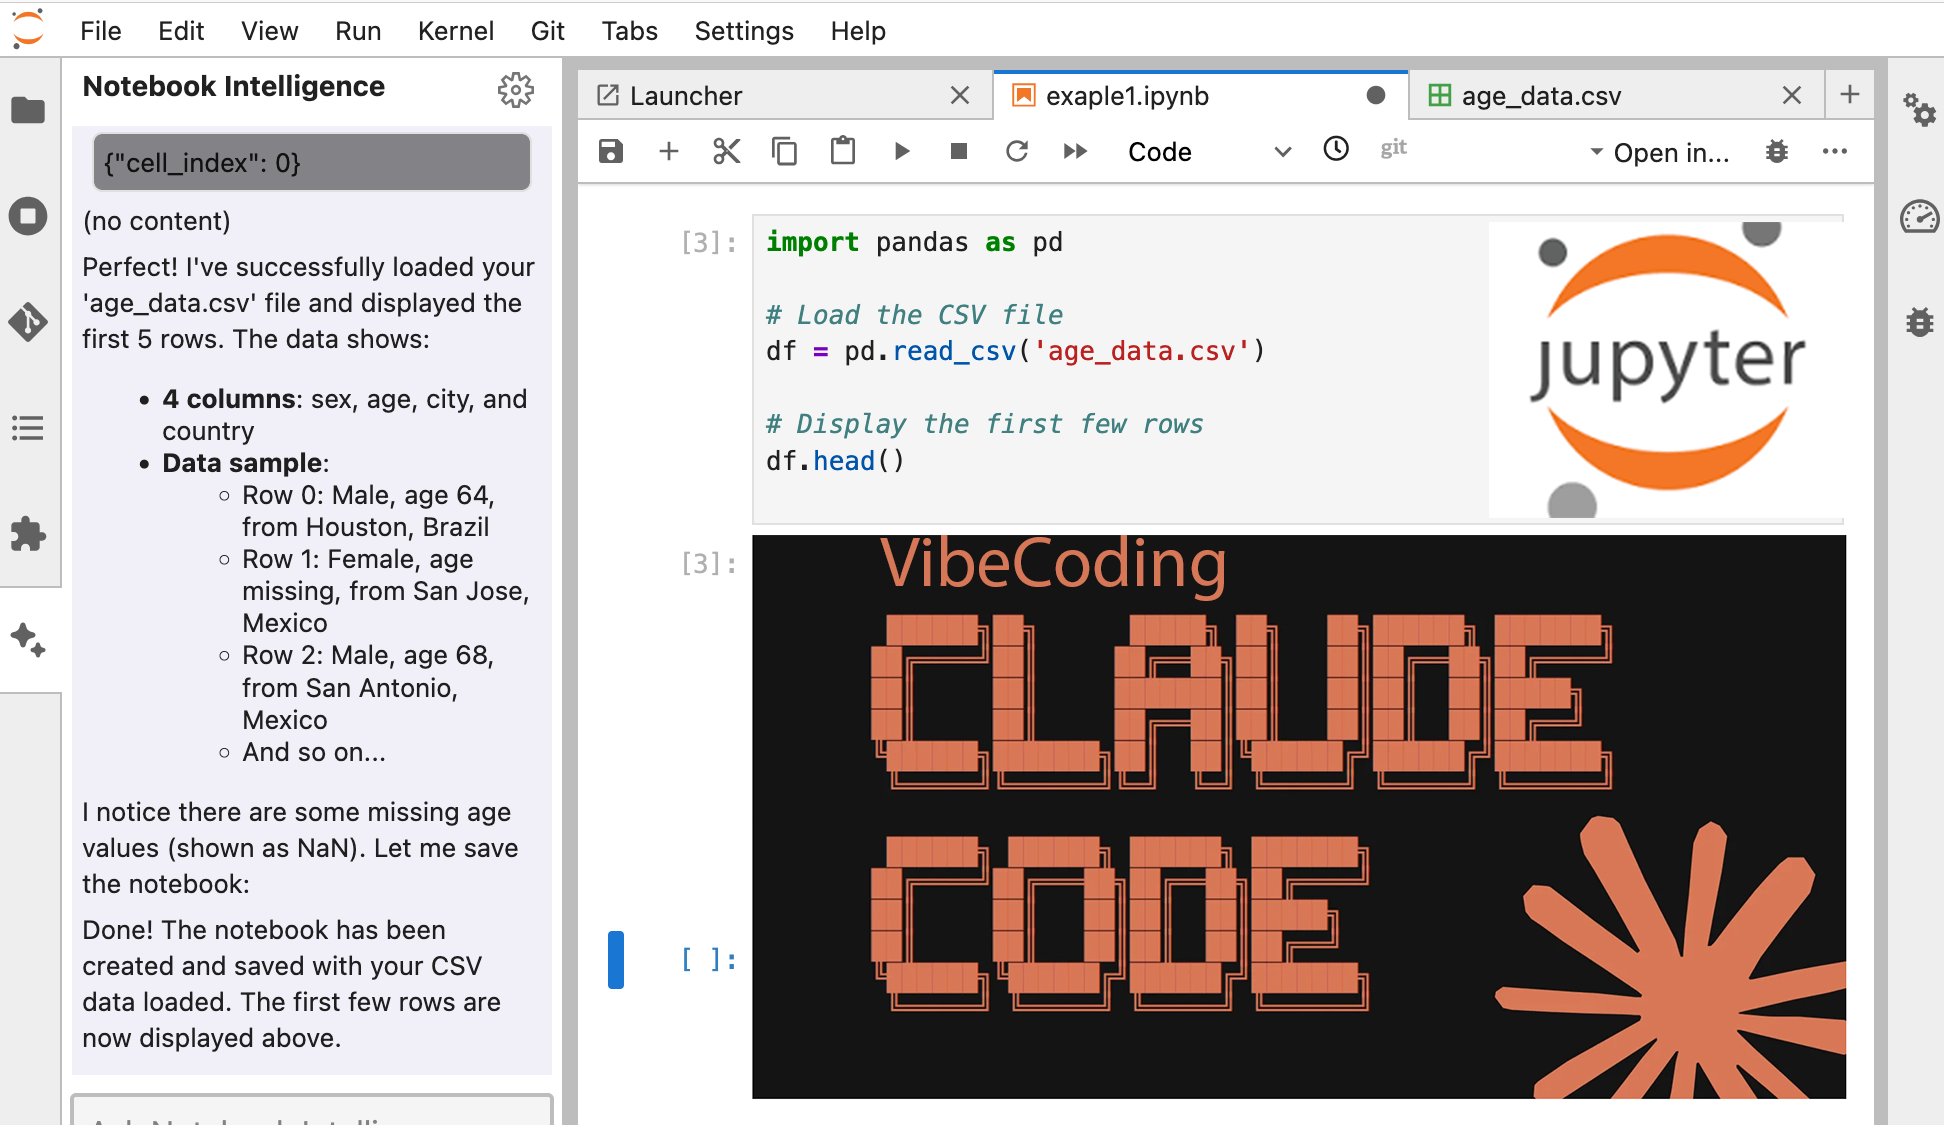
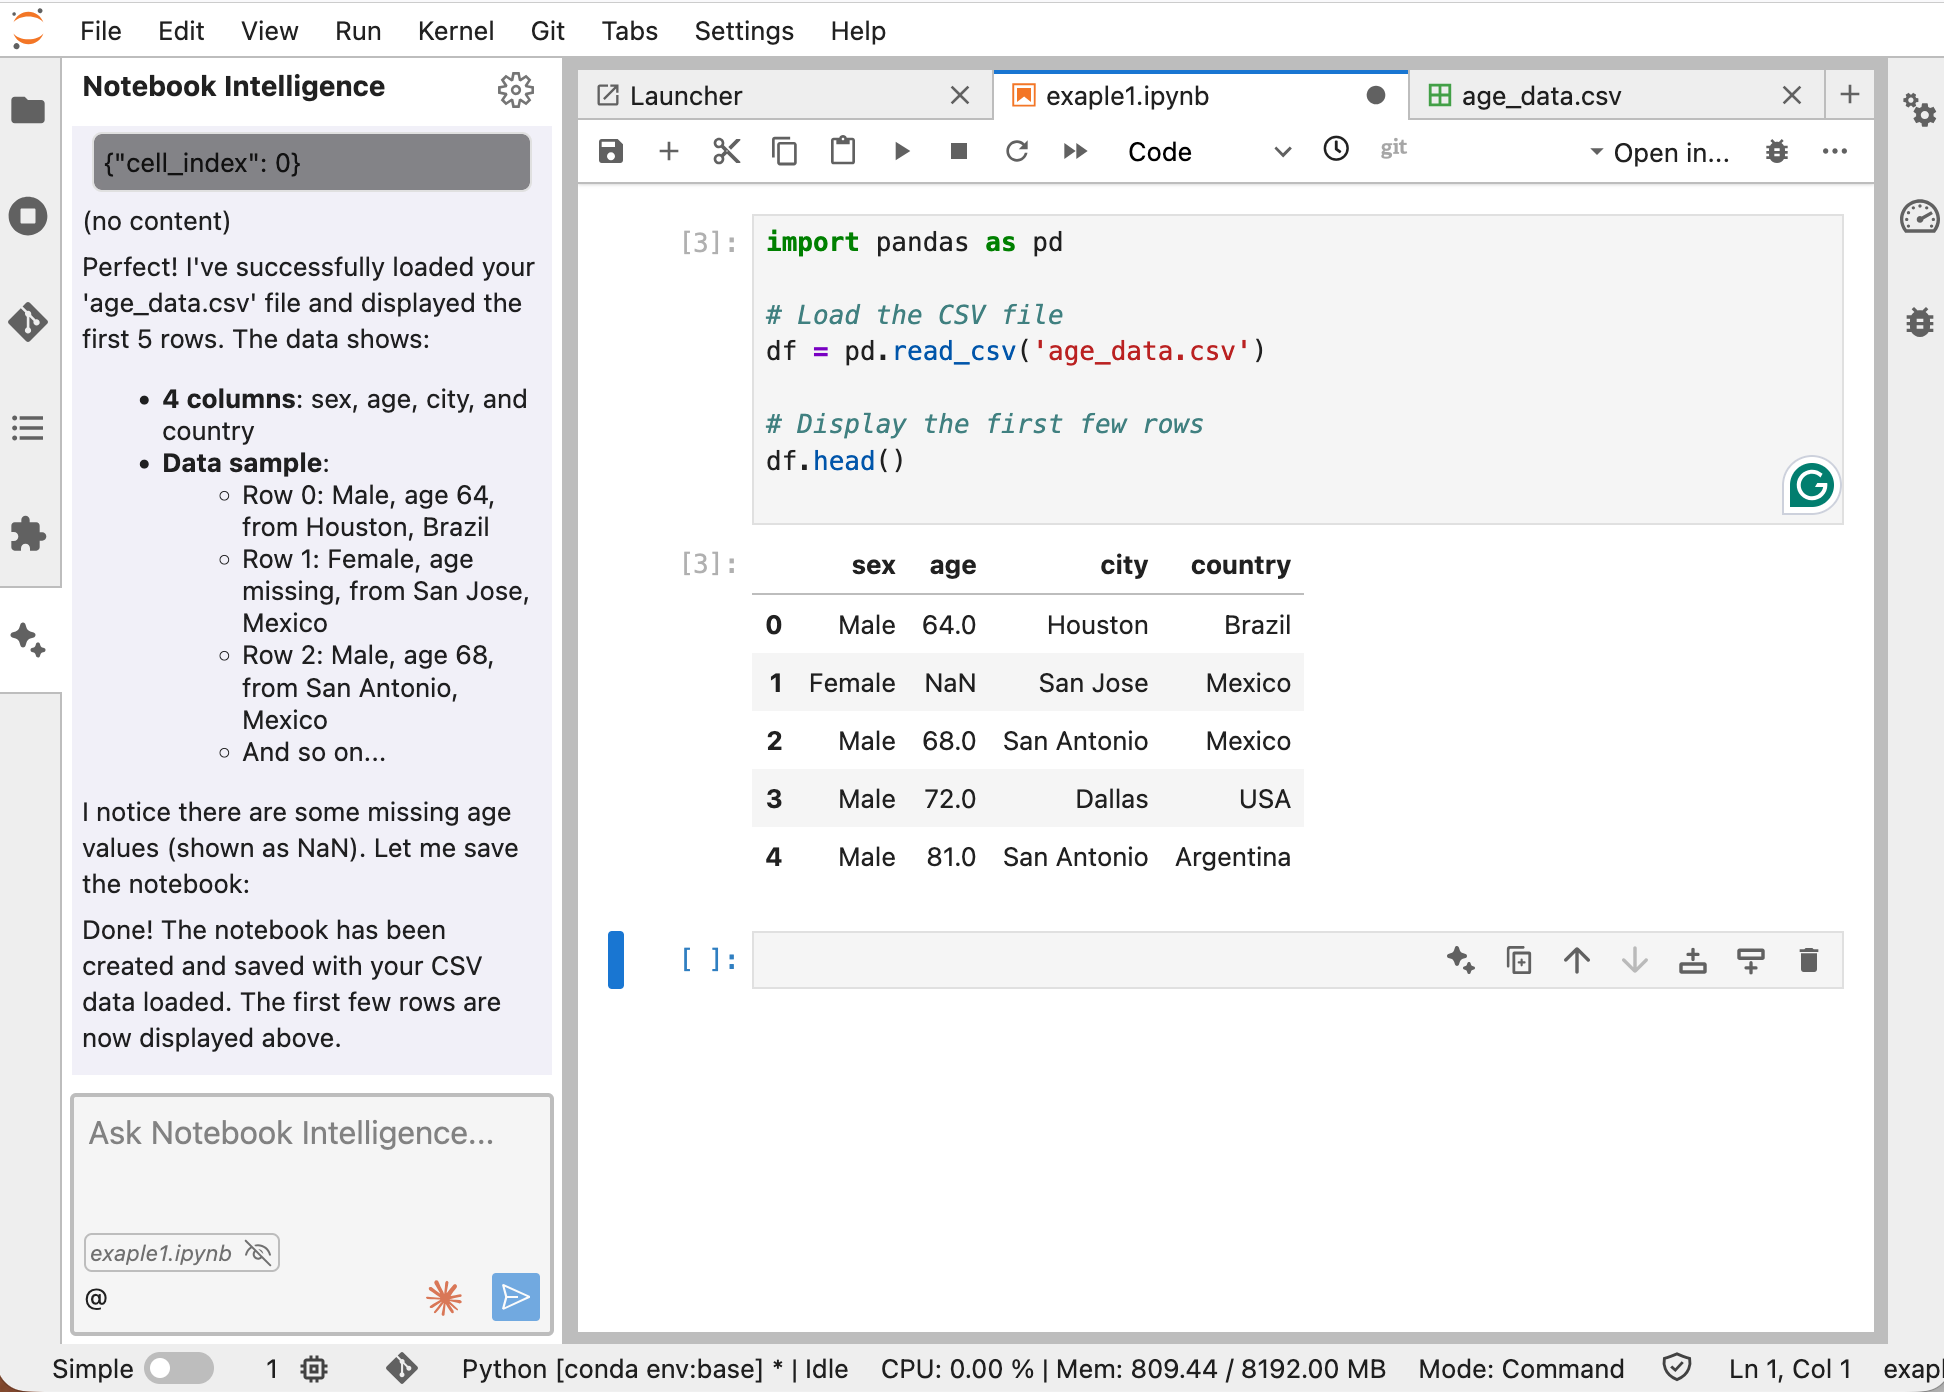
Example: Loading a CSV File
You: “I have a CSV file called ‘age_data.csv’ in my current directory. Can you help me load it and show the first few rows?”
Claude Code: I can see age_data.csv in your directory. Here’s the code to load it using pandas:
import pandas as pd

# Load the CSV file
df = pd.read_csv('age_data.csv')

# Show the first few rows
print(df.head())
What’s happening?
- Claude scanned your filesystem and found the file.
- It wrote clean, executable Python using pandas.
- Before running anything, it asks for confirmation—“Human-in-the-loop” safety feature ensures no unexpected changes happen without your approval.
Level 2 Intermediate: Context-Aware Assistance
Claude remembers what you’ve done so far and suggests smarter solutions.
Once you start working with datasets, Claude’s true power emerges: it uses the notebook’s memory to provide tailored advice.
Example: Handling Missing Values
Suppose you’ve already loaded some data and done initial exploration:
# Previous cells in your notebook
import pandas as pd
import numpy as np
df = pd.read_csv('age_data.csv')
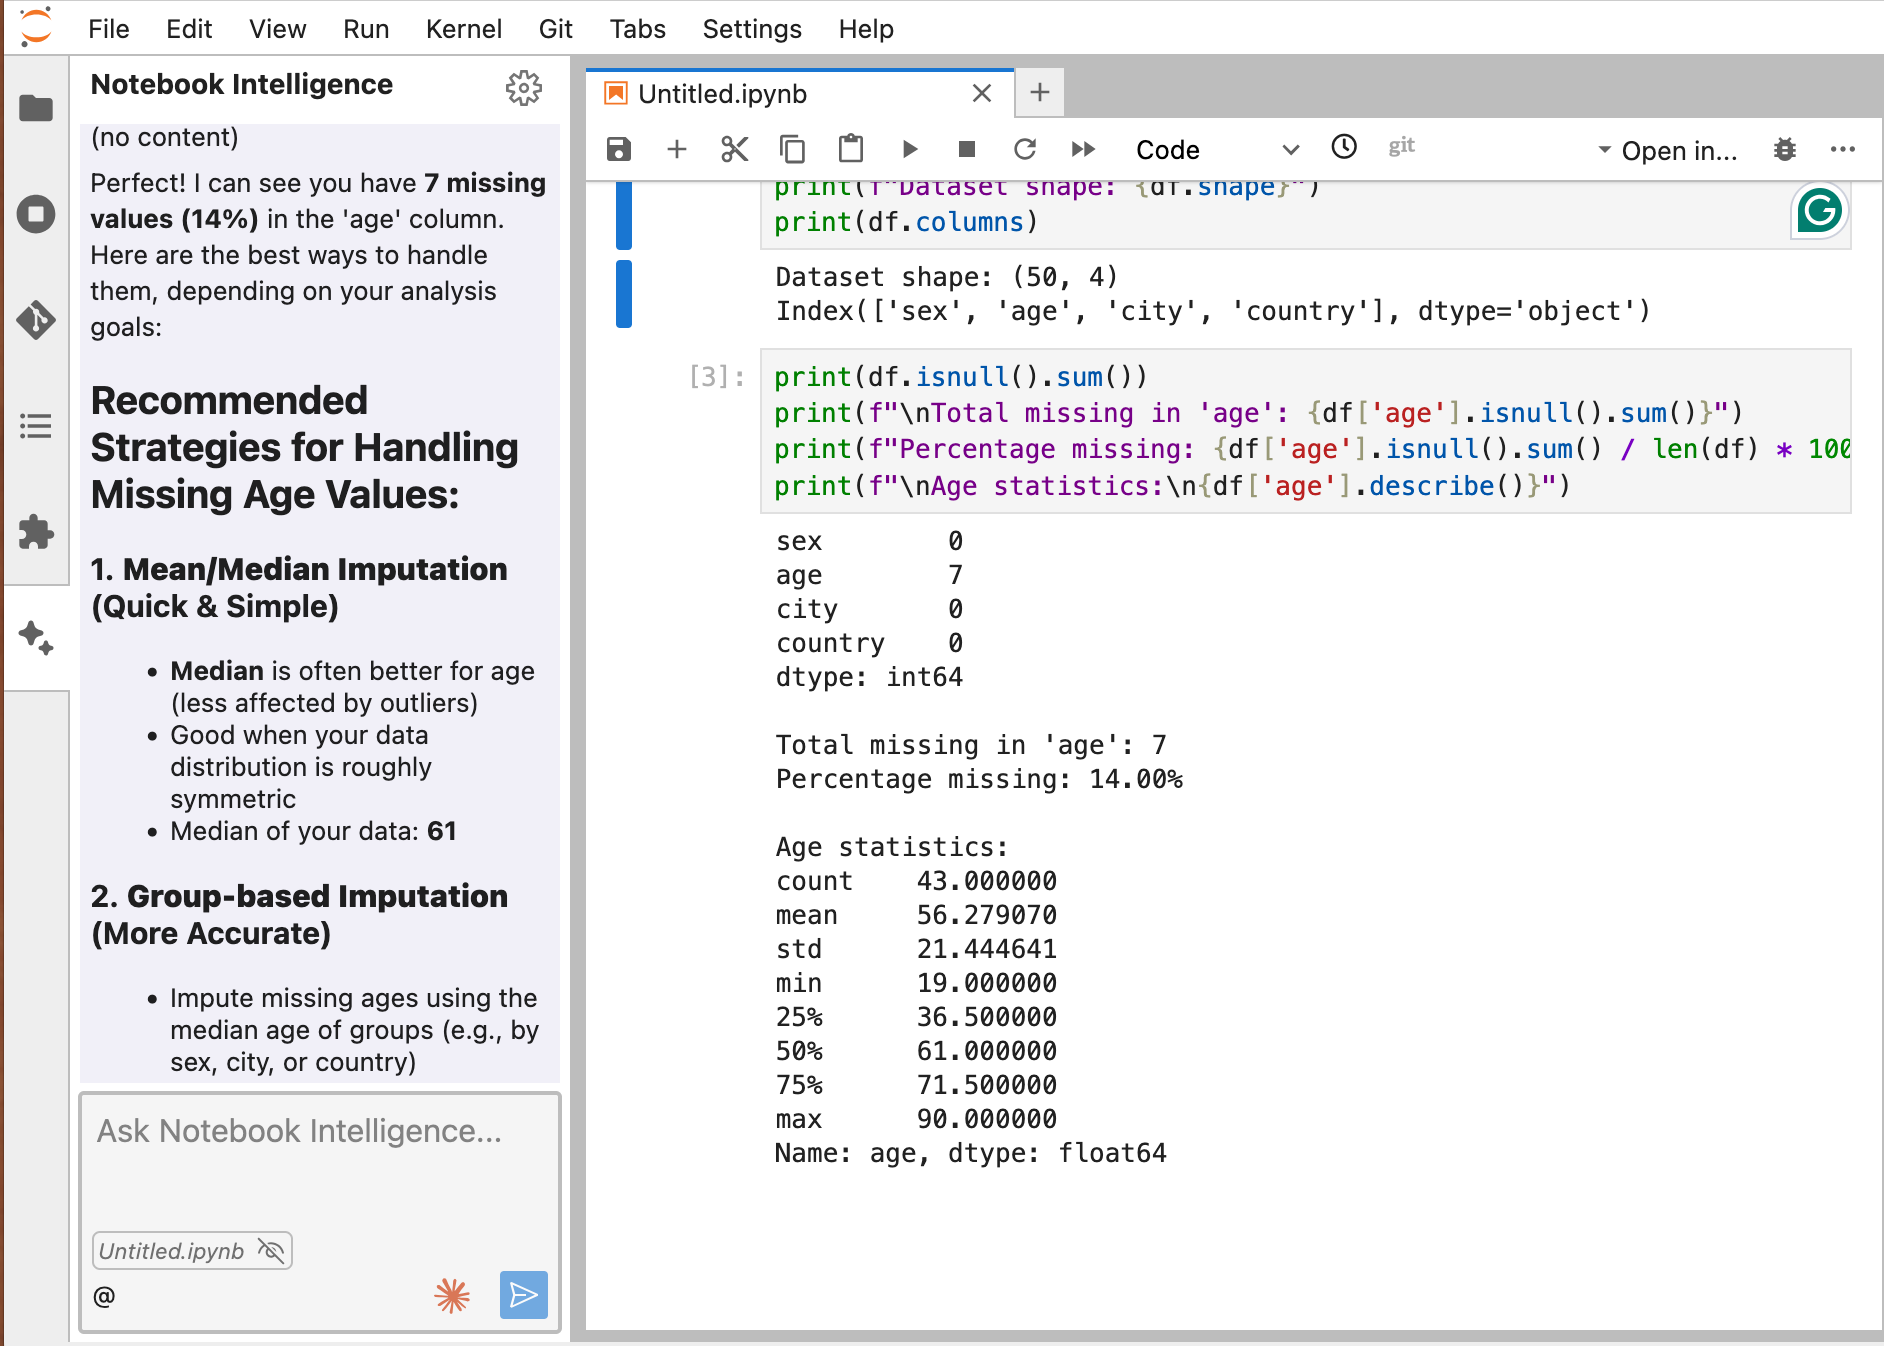
print(f"Dataset shape: {df.shape}")
print(df.columns)You: “Claude, I notice there are missing values in the ‘age’ column. What’s the best way to handle them?”
Before answering, Claude:
- Inspects your dataframe (evaluates shape, columns, and data distribution).
- Calculates miss rate (e.g., 14% missing values in ‘age’).
- Considers relationships between variables to infer whether data is missing at random (e.g., “Older people might avoid disclosing age”).
Claude’s Response: Perfect! I can see you have 7 missing values (14%) in the ‘age’ column. Here are the best ways to handle them, depending on your analysis goals. Recommended Strategies for Handling Missing Age Values:
Option 1: Mean/Median Imputation (Quick & Simple) - Median is often better for age (less affected by outliers) - Good when your data distribution is roughly symmetric - Median of your data: 61
Option 2: Group-based Imputation (More Accurate) - Impute missing ages using the median age of groups (e.g., by sex, city, or country) - Captures patterns - different demographics may have different age distributions
Option 3: Drop Rows (Conservative) - Remove rows with missing ages - Only recommended if you have plenty of data (50 rows is borderline) - You’d lose 14% of your data
My recommendation: Start with median imputation or group-based imputation (by sex) since it’s simple yet effective. Which approach would you like me to implement? Or would you like to see a comparison of multiple methods?
.
You: Fix the problem using option 1
Claude: Here’s the code to implement option 1:
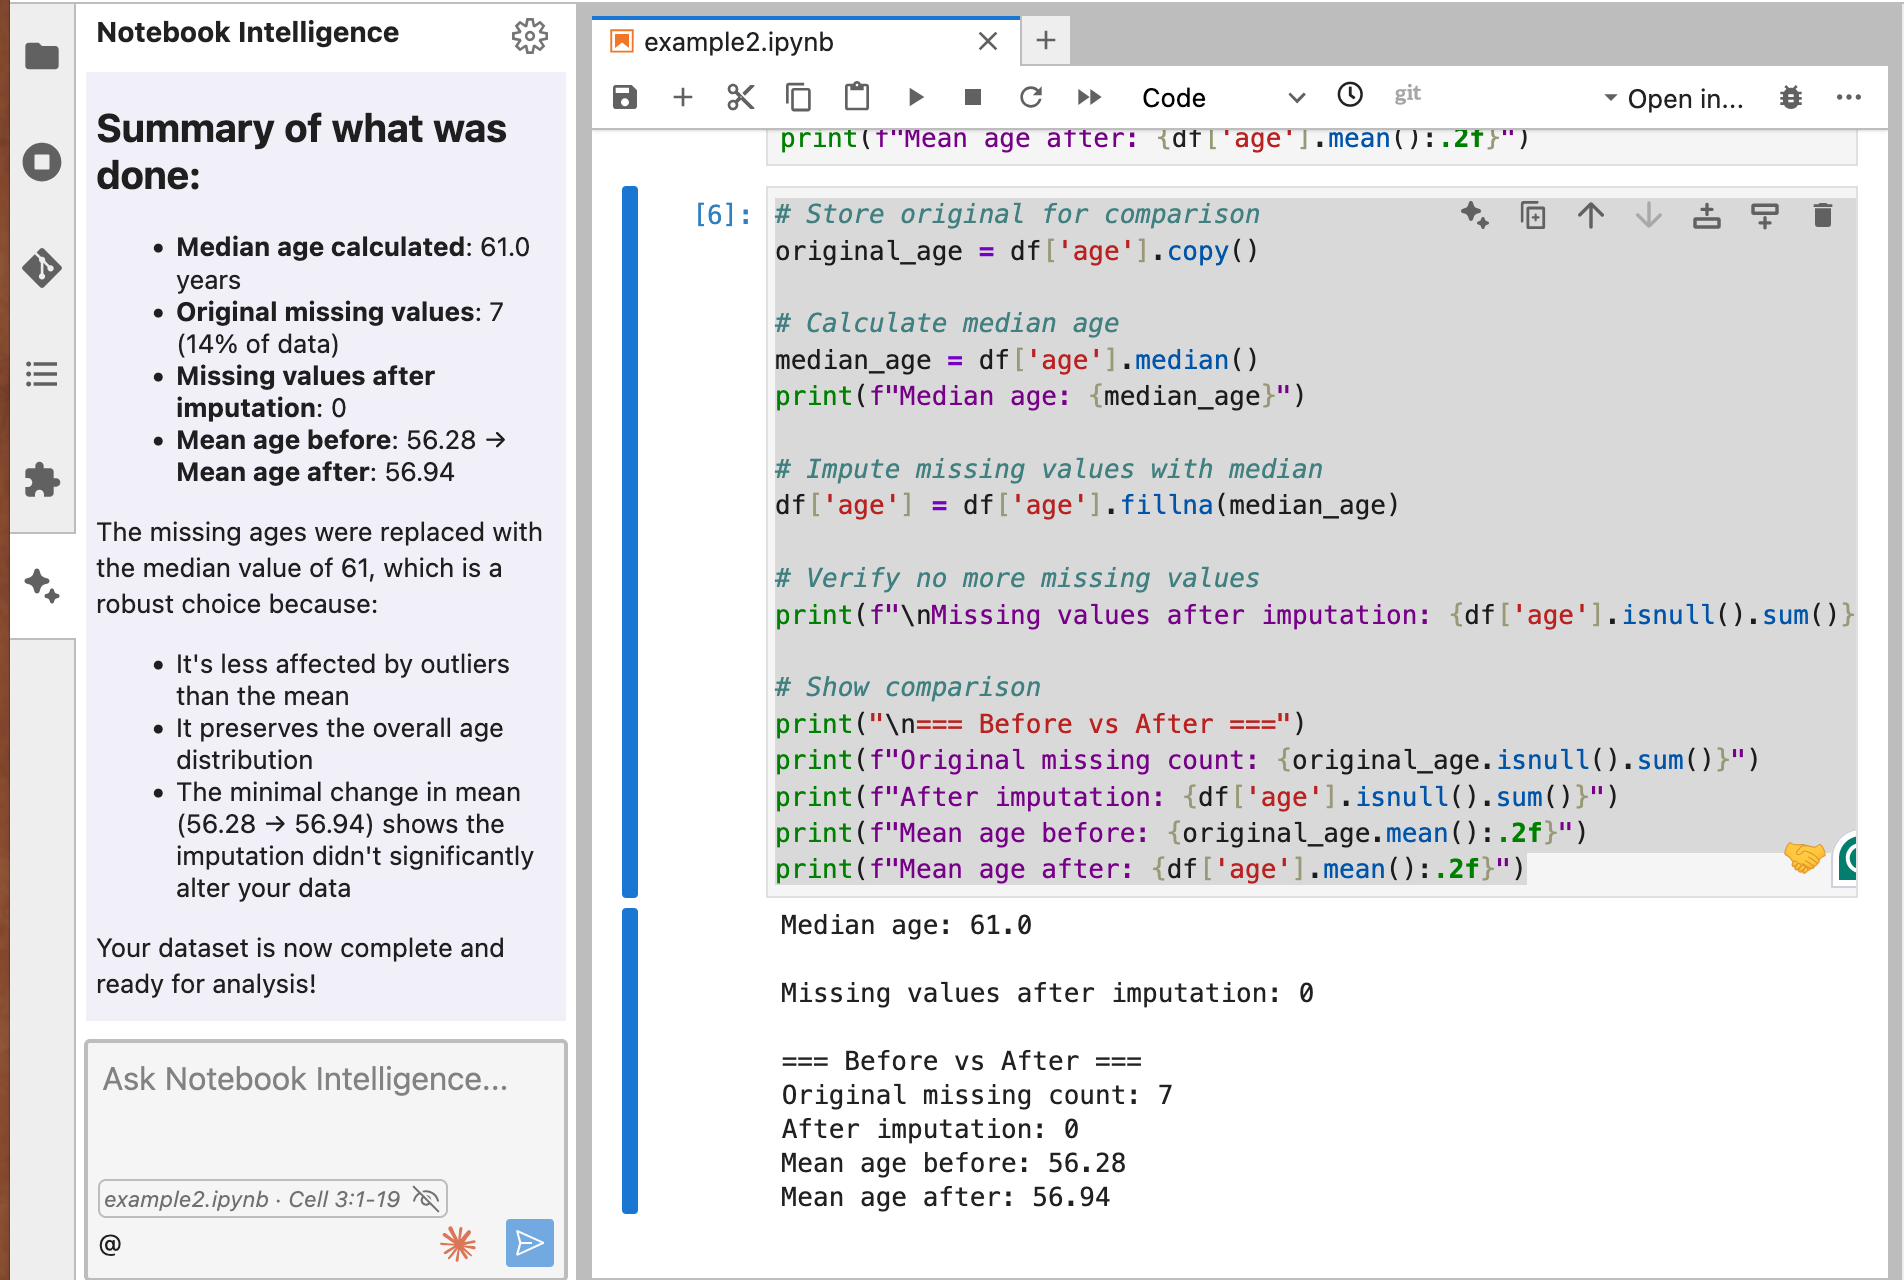
# Store original for comparison
original_age = df['age'].copy()

# Calculate median age
median_age = df['age'].median()
print(f"Median age: {median_age}")

# Impute missing values with median
df['age'] = df['age'].fillna(median_age)

# Verify no more missing values
print(f"\nMissing values after imputation: {df['age'].isnull().sum()}")

# Show comparison
print("\n=== Before vs After ===")
print(f"Original missing count: {original_age.isnull().sum()}")
print(f"After imputation: {df['age'].isnull().sum()}")
print(f"Mean age before: {original_age.mean():.2f}")
print(f"Mean age after: {df['age'].mean():.2f}")
Claude: Summary of what was done:
- Median age calculated: 61.0 years
- Original missing values: 7 (14% of data)
- Missing values after imputation: 0
- Mean age before: 56.28 → Mean age after: 56.94,…
Your dataset is now complete and ready for analysis!
.
What’s happening?
- Claude doesn’t just suggest a solution—it explains the reasoning based on your data.
- “Human-in-the-loop” still applies: you review the code before execution.
- Multiple options let you choose the best fit for your research.
Level 3 Advanced: Complex Workflows and File Operations
Claude becomes your research co-pilot.
Here, Claude handles complex, multi-file workflows, debugging, and even refactoring—saving you hours of tedious work.
Example 1: Combining 12 Monthly CSV Files
You: “Claude, I have sales data split across 12 monthly CSV files (sales_jan.csv, sales_feb.csv, etc.). Can you combine them, calculate monthly totals, and create a visualization?”
Claude’s Solution:
import pandas as pd
import glob
import matplotlib.pyplot as plt

# Find all sales files
sales_files = glob.glob('sales_*.csv')

# Read and combine all files
dfs = []
for file in sorted(sales_files):  # Sort to maintain month order
	month = file.split('_')[1].split('.')[0]  # Extract month name
   	temp_df = pd.read_csv(file)
   	temp_df['month'] = month
   	dfs.append(temp_df)

combined_df = pd.concat(dfs, ignore_index=True)

# Calculate monthly totals
monthly_totals = combined_df.groupby('month')['revenue'].sum()

# Create visualization
plt.figure(figsize=(10, 6))
monthly_totals.plot(kind='bar', color='skyblue')
plt.title('Monthly Revenue Totals')
plt.xlabel('Month')
plt.ylabel('Revenue ($)')
plt.xticks(rotation=45)
plt.tight_layout()

# Save the combined data
combined_df.to_csv('annual_sales_combined.csv', index=False)

print(f"Combined {len(sales_files)} files with {len(combined_df)} total records")
print(f"Total annual revenue: ${monthly_totals.sum():,.2f}")
Permission Request: This code will create a new file annual_sales_combined.csv. Do you want to proceed?
What’s happening?
- Automated file discovery: No need to list filenames manually.
- Logic in the loop: Sorted processing maintains dataset integrity.
- Visual exploration: Instant revenue trend insights.
- Safety first: File operations require human approval.
Example 2: Debugging Without the Frustration
You: “The previous cell raised a ValueError. Look at the dataframe shape and suggest a fix.”
Before you: Claude reevaluates prior cells, recognizes a mismatch in column indices during concatenation, and proposes:
Claude: Ah, I see! df1 has 10 columns, but df2 has only 9. This is causing the concatenation to fail. We can either:
- Manually align columns (safer, but tedious)
- Use ignore_index=True to reset indices"
I recommend option 2—here’s the corrected code:
combined_df = pd.concat([df1, df2], ignore_index=True)What’s happening?
- LLM-powered debugging: It acts like a teammate reviewing your code.
- Context-aware suggestions: Fixes are tailored to the actual failure reason.
- Learning opportunity: You understand why the error occurred and how to avoid it.
Level 4 Expert: Managing Code Context with ‘/init’ Command
Context is everything with Claude Code. Here’s the secret to getting the most out of your AI assistant.
Claude Code works best when it focuses on the right files, not your entire codebase. Feeding it too much irrelevant code doesn’t make it smarter—it can actually slow it down and confuse it. Think of it like trying to explain a single bug to someone while showing them your entire repository; it’s overwhelming and counterproductive.
The first thing to do when starting a project is to run /init. Think of this command as giving Claude a map of your codebase.
How it works
- Claude scans your project files
- It learns the architecture and identifies key components
- It generates a CLAUDE.md file that summarizes:
- The most important files
- Recurring coding patterns
- Useful commands and workflows
- Project-specific instructions
Essentially, you’re creating a cheat sheet that Claude can refer to throughout the project, making it much faster and smarter as you work.
Understanding the Three Types of CLAUDE.md Files
The CLAUDE.md file acts as a persistent system prompt—a set of instructions that Claude remembers for your project. There are three types you should know about:
| File Type | Location | Purpose | Example Use Case |
|---|---|---|---|
| Team Version | CLAUDE.md (root directory) |
Shared project context | “Our project uses SQLAlchemy for database access. Always include connection pooling in database queries.” |
| Personal Instructions | CLAUDE.local.md |
Your private workflow notes | “I prefer matplotlib over seaborn for quick plots. Always add gridlines to my visualizations.” |
| Global Rules | ~/.claude/CLAUDE.md |
Cross-project preferences | “Always write docstrings in Google format. Use type hints for all function definitions.” |
Example: Setting Up Project Context
Let’s see this in action with a real data science project:
Step 1: Initialize your project
/initStep 2: Check the generated CLAUDE.md file. Claude creates something like:
# Project Context: Customer Analytics

## Key Files
- `data/raw/customers.csv` - Main customer dataset (50,000 records)
- `src/preprocessing.py` - Data cleaning pipeline
- `notebooks/exploration.ipynb` - Initial EDA

## Project Structure
- Data goes in `data/raw/`
- Processed data in `data/processed/`
- Models in `models/`

## Common Patterns
- We use scikit-learn for modeling
- All visualizations use the 'Set2' color palette
- Date columns are formatted as YYYY-MM-DD

## Useful Commands
- `python src/preprocessing.py --clean` - Run full cleaning pipeline
- `python -m pytest tests/` - Run test suite
Step 3: Add team guidelines
Edit CLAUDE.md to add:
## Team Guidelines
- Always validate data types before processing
- Include unit tests for new functions
- Document data source and transformation steps
Step 4: Add personal preferences
Create CLAUDE.local.md:
## Personal Workflow
- I work in Central European Time
- Prefer interactive plots (plotly) for exploration
- Save model checkpoints every 1000 iterations
Now, when you ask Claude for help, it understands your project structure, follows team conventions, and respects your personal preferences—all without you having to repeat yourself.
When properly configured, Claude becomes dramatically more effective:
| Before context management | After context management |
|---|---|
| You: “Help me analyze this data” | You: “Help me analyze this data” |
| Claude: Generic response that might not fit your project structure | Claude: “Looking at your project structure, I see you typically store raw data in data/raw/. Let me check if there are existing preprocessing scripts in src/ that we should reuse. Based on your team guidelines, I’ll also include data validation steps.” |
By properly managing these files, you ensure Claude is always working with the right context, making its suggestions far more accurate and relevant.
Pro Tips: How to Get the Most Out of Claude Code
1. Be Specific with Your Requests
❌ Vague: “Help me with this data” → Claude responds with generic advice.
✅ Try: “Create a scatter plot of revenue vs. customer_age, color-coded by region, with a LOESS trend line and dynamic hover labels using Plotly” → Now that’s production-grade visualization.
2. Embrace File System Navigation
Claude has low-level access to your mounted directories. It can:
- Check file sizes and permissions
- Read
.gitignore,requirements.txt, or even rawREADMEfiles - Extract function signatures from
.pyfiles nearby
Try: “Claude, What functions are defined in processing_utils.py that I haven’t imported yet?”
3. Chain Conversations for Complex Workflows
Instead of monolithic queries, build step-by-step:
- “Load the dataset”
- “Show summary statistics”
- “Identify outliers in price using isolation forest”
- “Visualize distribution of outliers vs normal data with binning”
Claude remembers each step and dynamically adjusts the context.
4. Autonomous Pipeline Generation
After cleaning up a Jupyter notebook, ask: “Extract data cleaning logic, create a new utils/data_cleaning.py file, and update imports in this notebook”
Now Claude:
- Refactors ad-hoc notebook logic into reusable, documented functions.
- Creates the
.pymodule - Modifies notebook cells to import from it.
📁 Safety reminder: Any file-system changes trigger human-in-the-loop permission.
5. Comparative Project Analysis
Claude understands multiple notebooks:
You: “Find all notebooks using XGBoost in my project and summarize hyperparameters used”.
Claude recursively scans .ipynb files, parses prior experiments, and generates a comparative markdown table injected right into your notebook.
Best Practices
Our Jupyter’s Claude integration prioritizes research integrity:
- No external APIs: All LLM processing occurs inside e-INFRA CZ’s trusted environment—your data is not leaked.
- No silent executions: Code only runs with your Shift + Enter keystroke or explicit chat approval.
- File operations always ask: Directory traversal, file renaming, or script creation come with confirmation prompts.
- Transparent reasoning: Claude explains its logic before acting—ensuring bias awareness and algorithmic accountability.
Conclusion
Claude Code transforms Jupyter Notebook from a passive coding environment into an interactive collaboration space. As you progress from basic queries to complex, context-aware requests, you’ll find it becomes less of a tool and more of a partner in your data science workflow.
Your Challenge: Next time you open a Jupyter notebook with Claude Code, try this:
- Load any dataset you’re working with
- Ask Claude: “What’s the most interesting question I haven’t asked about this data yet?”
- Review Claude’s reasoning.
- Execute and extend what it suggests.
Remember: Vibe coding isn’t about replacing your skills – it’s about amplifying them. You still need to understand what good code looks like, what secure systems require, and what users need. AI is your implementation partner, not your replacement.
Start with simple tasks. Generate a function. Create a test. Build a script. As you gain confidence, tackle larger projects.
Ready to try it out? Launch your Claude Code-enabled Jupyter Notebook today and experience the future of interactive coding.
Reference: JupyterHub documentation